
Analytics page
The Analytics page provides an overview of the project progress.
By using the tabs on the left side of the screen, you can select whether you want to access:
Permissions per user role in project Analytics page
| Permissions | Project admin | Team manager | Reviewer | Labeler |
|---|---|---|---|---|
| View analytics | ✓ | ✓ | ✓* | ✓* |
*Generally, all member roles can access the Analytics page. Reviewers and labelers can only access analytics data about their own work, though.
Overview
Overview contains a snapshot of the project. You can trace what's already been done and access a quick summary of open questions and skipped assets.
Use the visual progress bar to quickly check how many assets have been annotated, reviewed, or still left to do and then click on a specific category to immediately jump to the correctly filtered Explore view.
Visual progress bar
Additionally, you have access to an overall class balance, that is information on what percentage of the total number of annotations are labels given to a specific class. For extra granularity, you can select either the whole project or drill down to specific labeling jobs.
Class balance data
Performance
From the Performance tab, you can check how many assets are being labeled and reviewed in a daily, weekly and monthly time frames. Note that we're taking into account actions, not just assets. So if two or more project members labeled (for example as part of consensus) or reviewed the same asset, the number will be higher.
Accessing performance data
From here, you can also access detailed labeling statistics that you can later export as a .csv file and process outside Kili.
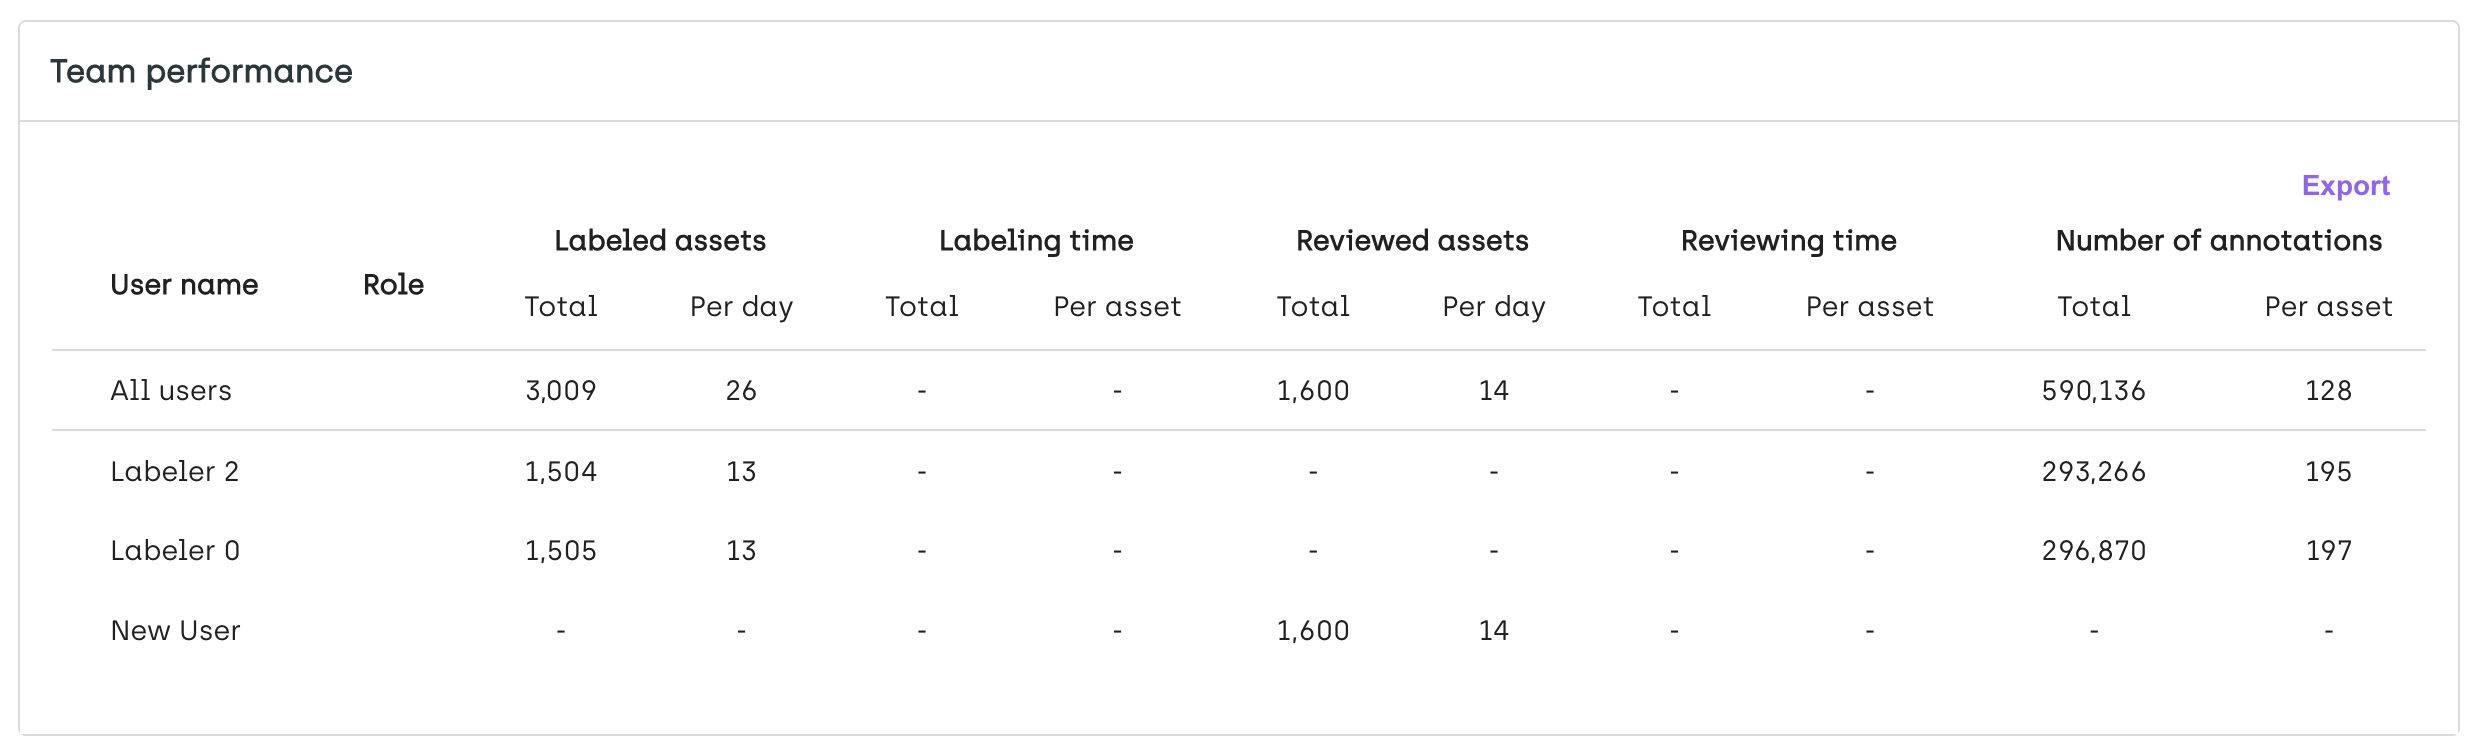
Team performance data
Through performance metrics you can assess the velocity of your team after the project has been running for some time. How is it evolving per asset? Are some of the assets outliers? If so, why? Is the performance consistent with what you were expecting? How does it affect your project timeline? Once you have all this information, you can then deep dive and analyze available data per annotator to see if you can spot any discrepancies and items to focus on.
Quality Insights
From the Quality Insights tab, you have access to insights regarding consensus and honeypot metrics (if you set them up in your project). Information is presented per class (with an option to delve deeper, per job) and per labeler. You also have access to an overall total agreement score for consensus and honeypot. For information on how these are calculated, refer to Calculation rules for quality metrics.
When done, you can click directly on the graph to switch to the Explore view and start your review.
Accessing quality insights
Use the graphs and scores to target the most relevant assets to focus your review on. For example, if you spot a class with the lowest consensus mark, you can then check on it by using the [Explore view](doc:explore-view to properly research and address this issue.
If neither Consensus nor Honeypot are set in your project, the Quality Insights tab shows the review score per labeler. The review score calculations for each asset are made by comparing the original label (either added by a human or by a model) with its reviewed version. This metric provides additional insight into how well the team is performing. Additionally, the tab contains information on how the review score evolved over time. For information on how Kili app calculates the review score, refer to Calculation rules for quality metrics.
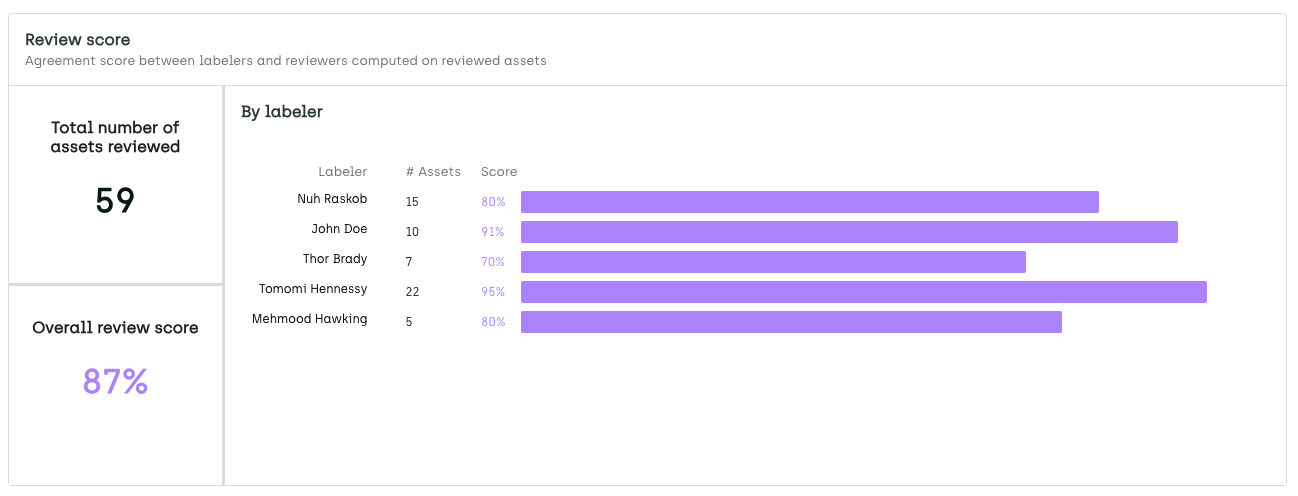
Review score by labeler
Updated 9 months ago